Dashboards are a powerful way to present large amounts of data quickly and easily to your audience, engage employees and even encourage changes in behavior. Anything you can measure can be presented on a digital dashboard – energy consumption, CSAT rates, current lead generation, sales targets, just to name a few.
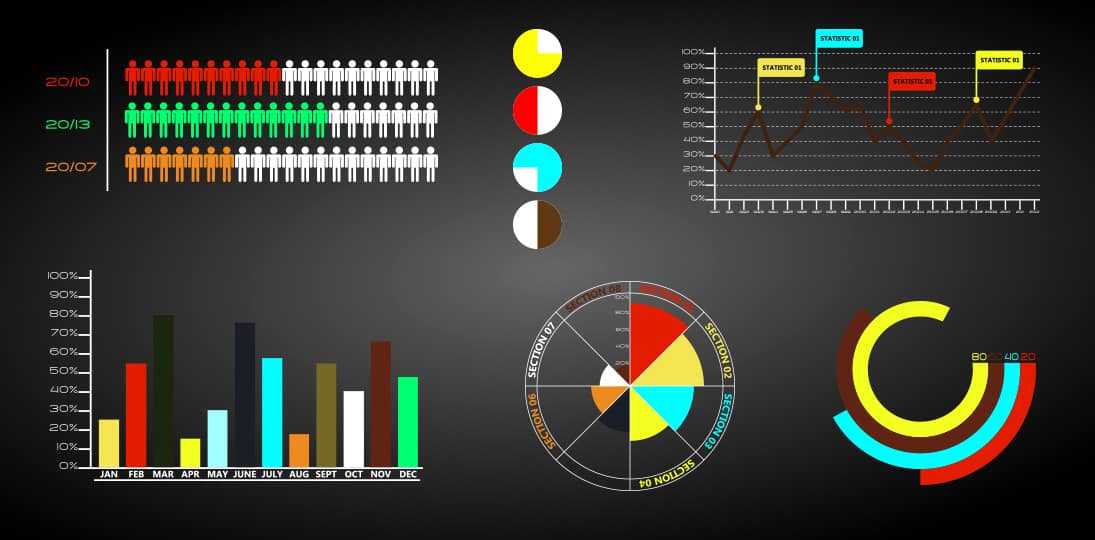
Dashboards pull in data from KPIs, spreadsheets and multiple other sources, presenting the information graphically so all the information needed can be taken in at a glance. This is key to good dashboard design – keep it simple, just the most relevant and illustrative data streams. If you overload your screen, you’ll also overload your audience, and they’ll stop paying attention.
Think of who your idealized audience is – who is the information for? What do you want them to do with it? Then think about which four or five (maximum) bits of information will encourage them to take the action you want. You can always make more details available on your intranet or project portals by integrating your dashboard with those sources, but what’s displayed on your digital signs needs to be recognized and understood immediately.
If you want people to put in some extra effort, then show productivity statistics and progress towards goals. If you’re trying to encourage people to reduce energy consumption (because of green initiatives, and also to lower overhead costs), then display current water and power usage in real time with an ideal target. Add in extra information about energy reduction programs and tips, and you’re sure to see almost immediate, measurable results.
Including relevant, commonly-sought information, such as current time and weather, can be a visual hook that attracts people’s attention to the dashboard. Once they’re looking at it, the information you want them to see is right there and starts getting taken in.
Dashboards give context to content – there’s a lot of data out there to sift thought, but you and your team have carefully curated the most important factors to present, saving your audience time. This is a lot more effective than simply pointing people to a series of reports, spreadsheets or webpages that are filled with dozens of graphs and tons of statistics. People might intend to review it, but they just won’t get around to it since the task seems so daunting.
Present your information visually – a few well-designed graphs can convey a huge amount of information in just moments. Use one or two high contrast colors, and keep backgrounds simple – no pictures, just a solid color to create a visual canvas that makes the graphs and data stand out.
And always include some sort of call to action – a goal to be reached in a set period of time is often effective, as is current status in relation to other organizations or departments. People see how their efforts contribute to measuring up against the competition or goals, which is instantly motivating.
You can even gamify your efforts, offering real-world benefits to individuals, teams or departments that meet certain goals in a certain time period. This adds a sense of fun to things, and encourages people to keep checking the dashboards to see how they’re doing.
Since dashboards can update data in real-time, people can see the effects of their efforts immediately. No more waiting for the quarterly report to see progress – it’s right there on the screens, every day. And CMS software is getting more powerful and flexible at integrating data, and even making smart decisions on what to show, when.
Digital dashboards are one of the best tools your organization has to not only keep your employees engaged and up to date, but to get them to do things that you want them to. Use clean design, curate the most vital information, update regularly and encourage people to participate. Your dashboards will soon be an integral part of your organizational culture.