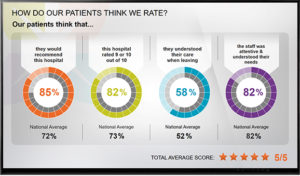
Data-triggered digital signage is where automated content feeds and data visualizations meet. We know that showing progress towards goals has important psychological benefits for an audience, and showing complex information in a visual format helps people understand even complicated things at a glance. This is also the area where the Internet of Things (IoT) overlaps with digital signage – machines talking to machines to get timely information onto digital signs.
Your organization might already have a form of data-triggered content in its alert system. But consider using it for more day-to-day solutions as well. Using easy widgets in AxisTV Signage Suite, on-screen information and artwork can be automatically updated when certain conditions are met – sort of an “if then, go to” situation (familiar to anyone with even rudimentary programming skills).
First, you need to understand the basics of data mapping. This may sound technical, but it’s actually very easy. For example, when you’re creating a message or layout in Signage Suite, you can use a drag-n-drop widget to insert an event schedule. You then “map” that widget to your calendar app to pull in the data automatically. That’s data mapping – it’s that simple. Some common sources that you can pull data from are zip codes (for weather), calendar apps (for schedules), Excel sheets (for anything), RSS feeds, webpages, XML and JSON files.
So, how do data mapping and data-triggered content work together? It’s a simple matter of combining two of Signage Suite’s widgets. By using the Widget Controller with the Artwork Widget, you can set up as many artwork changes as you like, all based on current conditions in your data source. Signage Suite can make decisions on what to show on screen based on numbers, words, times or other data elements you’ve mapped to. Let’s look at some examples.
Say you’re having a holiday food drive with a time-honored thermometer graphic showing progress toward the final goal. As more people donate, the thermometer fills up. This can be automated, so when someone on your team fills in the current numbers on an Excel spreadsheet, Signage Suite reads the numbers and adjusts the text on screen and the image being shown on your digital signs. This can be done for any graphic (a thermometer, a graph, an arrow, etc.) for any initiative that uses numbers (total number of closed service calls, number of sales finalized, etc.).
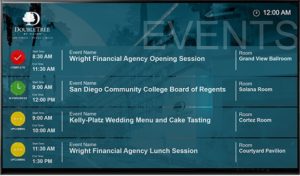
Times can also trigger automated artwork changes on digital signs. For example, you can show viewers instantly which meetings are complete, in progress and coming up with simple color-coded artwork next to listings. If an event is cancelled, people can see it instantly from a distance. Or think of countdowns. As an event or deadline approaches, the countdown image in messages changes accordingly. This doesn’t have to be just numbers – you could have, for example, an image of a calendar, with Xs over each day that’s passed as the deadline approaches.
Data-triggered artwork works great for time-sensitive offers or showing different graphics next to the same text throughout the day. For example, your campus café ad can have a basic layout that show a hot cup of coffee in the morning, a crisp salad during lunch and sugary snacks in the afternoon. Words can also trigger changes. Imagine having your digital signage system automatically show one photo based on the word “red” in a data source, another if the data says “blue”.
One main benefit here is that your team simply sets up the parameters for the data visualizations – what triggers the change and what the change will be – and then inputs the data in one place, and the digital signage system takes care of the rest. (And if your data source is also automated, that’s even less work for you.)
Buildings and spaces are becoming more digitized and “smarter”, and this requires a different idea of what communications are capable of. Data mapping and triggered content is great boon for communications teams, which are challenged with providing relevant, timely information all day, every day to a digitally literate and distracted audience. By using these tools, the information on your digital signs will be easily digestible and always up to date. Your audience will appreciate that.


